Here's an example of my work as a data analyst!
This is the finished product of one of the case studies I've completed. I started with a business problem and a large amount of raw data. I applied data storage, cleaning, manipulation, and analysis techniques, and created a simple, clear presentation to support stakeholders in making data driven decisions.
This example contains a statement of business task, some graphs to illustrate my findings, a brief explanation of the graphs, my recommendations for business solutions based on my findings, and also a recommendation for what other questions might benefit from further data analysis.
This analysis is based on a case study from the Google Data Analytics course. To see the code I used for entire process, including data cleaning and aggregation, please see the Bikeshare Case Study notebook on my Kaggle profile.
How do annual members and casual riders use Cyclistic bikes differently?
And how could casual riders be encouraged to buy an annual membership?
I found that riders with annual memberships to Cyclistic ride more on weekdays. Casual riders without memberships are more likely to rent Cyclistic bikes on weekends. Here's a visualization of those findings:
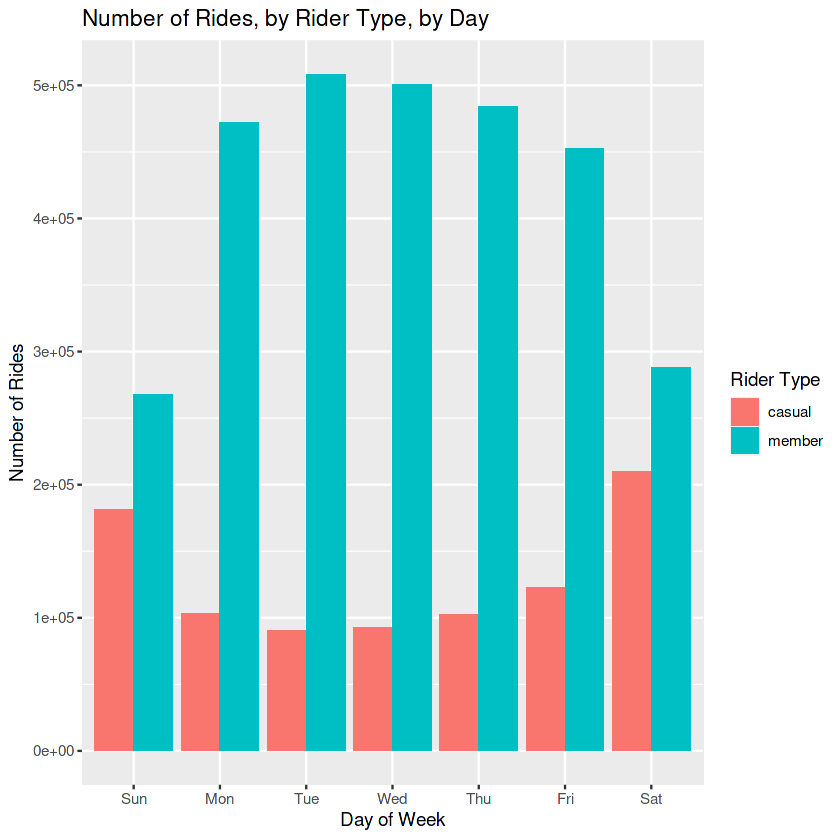
It's likely that annual members are using Cyclistic bikes to get to work, or to excercise regularly on weekdays. Both of these use cases are supported by the reliability and ease of access of Cyclistic bikes.
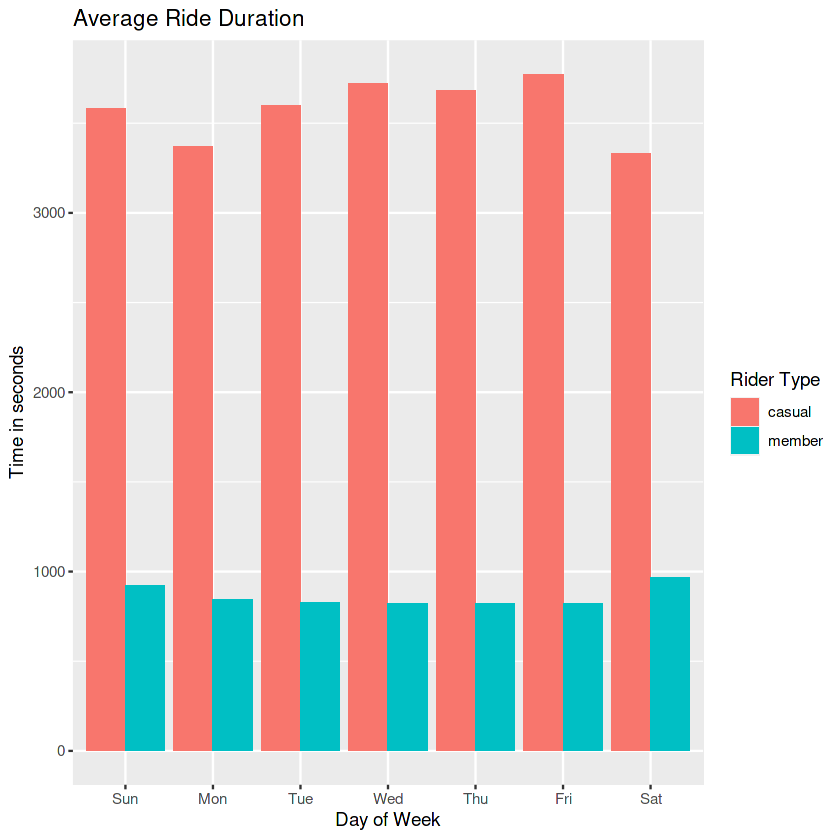
I also found that, regardless of the day of the week, casual riders (who don't have memberships) take, on average, much longer rides than annual members do. Non-members don't necessarily ride less: they just don't ride as consistently. This could be due to preference, but it could also indicate issues around easy access to Cyclistic bike stations for some riders.
Based on this analysis, here are my recommendations to encourage casual riders to buy memberships:
- Make sure the location and quantity of our stations allow people living in different areas of the city to conveniently, reliably access Cyclistic bikes for everyday use.
- Tailor advertising around the benefits of biking as an everyday activity, either for fun or to commute.
- Create a separate membership tier that features discounts for weekend riders and people who take longer rides with less frequency.
To further confirm and refine this analysis, it would be useful to conduct a rider survey on access issues and membership preferences.